Debugging an application is not always the most fun experience out there. Typically if you are debugging you are trying to dig into a problem, and more than likely deadlines are looming near. Therefore, anything to make the process a bit easier is usually a welcomed benefit.
Default Functionality
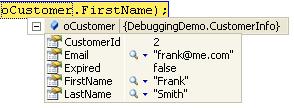
One of my biggest pet-peeves when it comes to the behavior of the debugger is how objects are explored. When debugging custom objects, the default view after mousing over simply provides the class name, not necessarily that helpful.

You can then get to the full class information by expanding the class, and you then will see a display similar to the following.

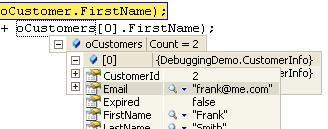
This process becomes even more tedious when working with a collection or list of custom objects, with nesting that doesn't provide anything helpful.

What Can We Do?
Luckily there is a nice, easy way to get around this using an Attribute that is available in the System.Diagnostics namespace. By adding a "using System.Diagnostics" statement to the top of our class, we can modify our class to include the DebuggerDisplay attribute, the completed "CustomerInfo" class is listed below.
[DebuggerDisplay("ID: {CustomerId}; FName: {FirstName}; LName: {LastName}")]
class CustomerInfo
{
    public int CustomerId { get; set; }
    public string FirstName { get; set; }
    public string LastName { get; set; }
    public string Email { get; set; }
    public bool Expired { get; set; }
}
With this attribute, we are able to set up a custom format string, the values included in curly-braces are substitutions for property values. With this simple change, we now can see the following when debugging individual objects and lists.


Conclusion
I hope that this information has been helpful. Feel free to share your comments below.