As I have mentioned in past posts here on this blog and via other communication channels I strongly believe that ANTS profiler which is offered by Red Gate software is a must-have tool for all software developers. Most recently with my day job, I have been working with profiler a lot more than usual and it prompted me to re-visit the concept of profiling within the constructs of a DotNetNuke installation. I've had many individuals with questions before about, is it possible to profile a DNN module, or how do you set it up. Well, this article will walk through all of the steps necessary to profile a single module within a local installation.
The Setup
The most important thing here is to ensure that you have a DotNetNuke installation setup in a proper manner that allows you to easily profile your module. This is a bit more complex than in a standard profile simply because your code is executing alongside many other modules code, therefore we have to take a few steps to ensure that profile captures your code specifically.
Remove .pdb's From Other Applications
The first step here is to investigate the /bin directory our the DotNetNuke installation that has the module installed for test purposes and remove any .pdb files. In my case this is my http://localhost/dnn47 installation. We need to remove the pdb files for the other applications so that we can include the PDB for our application and isolate calls using filtering built in to ANTS Profiler.
Copy Your .pdb to the Bin Directory
After validating that we have removed all other .pdb files from the /bin directory we will copy our application's pdb file into the /bin directory. For this tutorial, I will be showing a profile of the Expandable Text/HTML module, so my .pdb file is ICG.Modules.ExpandableTextHtml.pdb.
Starting the Profile
Now that we have set up the DotNetNuke installation for profiling, we can start up ANTS profiler. For this example, I am working with the performance profiler, but the memory profiler works in a similar manner.
Upon launching profiler you will see the following screen:
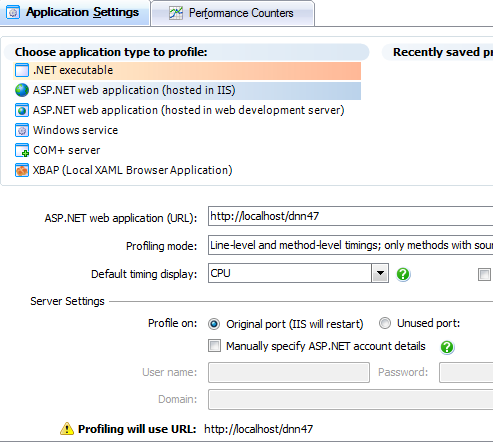
From here you can see the basic settings that we need to address:
- Application URL: This is the base URL to your test DNN installation
- Profiling Mode: Overall the best one is Line-Level and method-level timings; only methods with source
- Disable the option for "Profile Child Processes" unless you are threading inside your code that is being profiled. This helps reduce some clutter in the results
- Server settings will vary, this screen capture was taken on a Windows 7 machine, so I use the standard IIS port, but it requires an IIS restart to work
With this basic configuration out of the way, you can also configure any additional performance counters in which you might want to monitor, this is a personal preference depending on specifically on what you are doing. Now simply click "Start Profiling", you will see a new browser window open, from here go ahead an use your application a bit. Once you have run through your test case, simply exit the browser window or click "Stop Profiling" within ANTS.
Reviewing Results
I will not go over all of the specifics in's and out's of profiling an application within this article, but I want to quickly cover some display settings that will be helpful to ensure that you can focus on profile results for your application directly. Once the profile results display, for the "Display" options select the following:
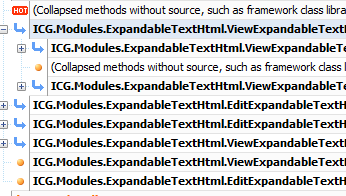
- Top-Down (Methods with source)
- (All Threads)
- Un-check the "Hide Insignificant Methods"
This should result in a display, that looks similar to the following, showing mostly your code methods, allowing for a quick review of your code performance.
Conclusion
I hope that this article has presented a quick overview of an easy way to profile applications for performance within a DotNetNuke installation. If there is community interest I will look at providing more articles on application performance tuning in the coming months. As always your feedback/comments are appreciated.